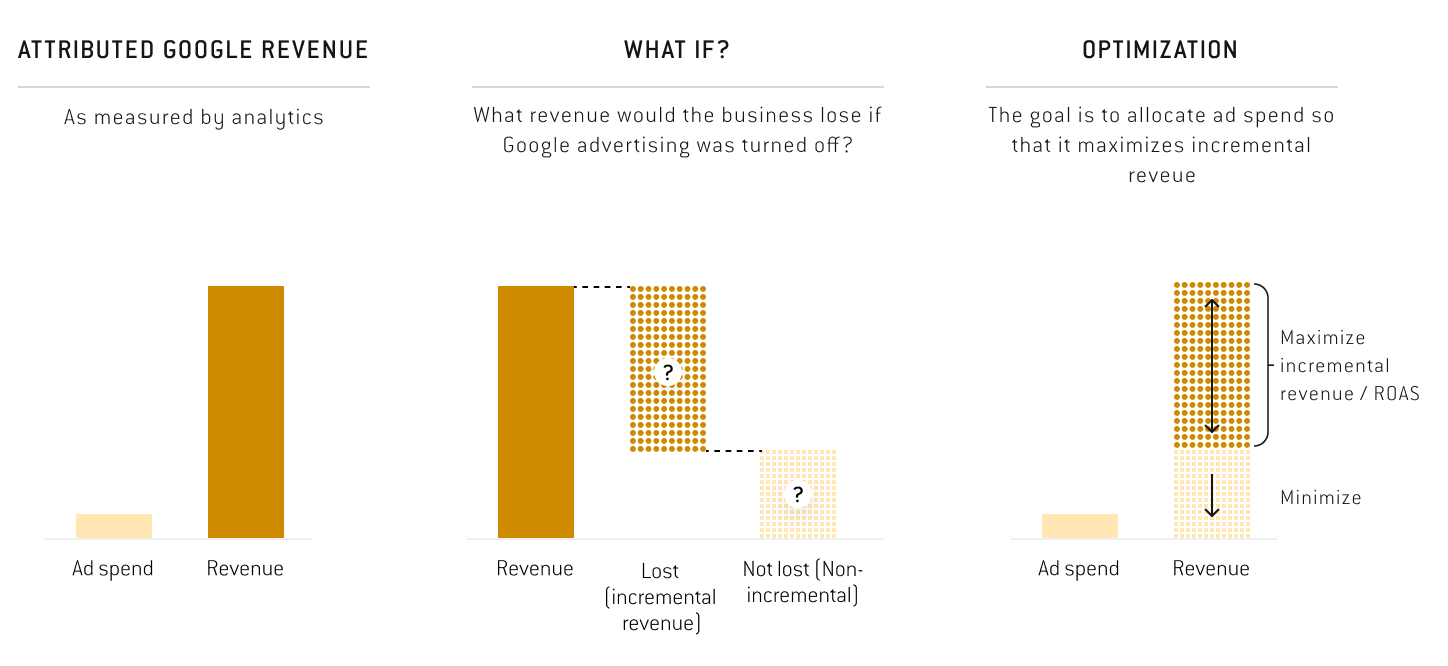
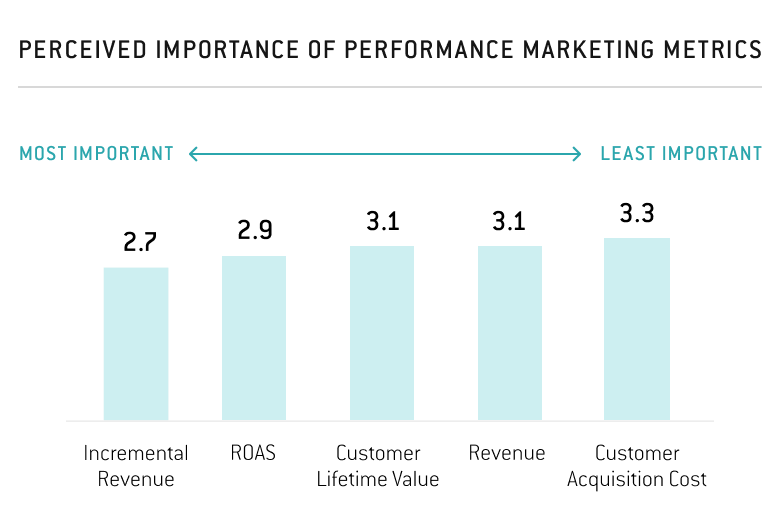
Incremental ROAS or iROAS (Incremental Return on Ad Spend) is the newer method of calculating performance indicators in marketing campaigns. Marketers across the globe prefer this more recent performance indicator. The logic behind iROAS is quite simple – if the brand gains a higher revenue than the ad spend used in customer acquisition, then the investment in the marketing campaign is a success.
Many brands expect excellent results from marketing managers through retargeting of KPIs and revenue. Since iROAS is still relatively new, there are a lot of queries and questions surrounding the calculation, metrics, viability, targets, and more.
This article is a quick guide to understanding and interpreting Incremental Return on Ad Spend (iROAS).
What Is Incremental Revenue?
Incremental revenue is the earnings of the brand only after the marketing spend (or marketing efforts). As marketers, imagine if the brand shut off all marketing efforts and only relied on sales to drive revenue. Now imagine the revenue generated with the marketing efforts and budget. The difference in revenue between the two circumstances or scenarios is incremental revenue.
What Is Incremental Return On Ad Spend (iROAS)?
Marketers use iROAS to calculate which of the marketing media tactics are working and which aren’t. It is quite similar to how ROAS is calculated, which is Revenue / Cost. The calculation for iROAS is Incremental Revenue / Ad Spend = iROAS
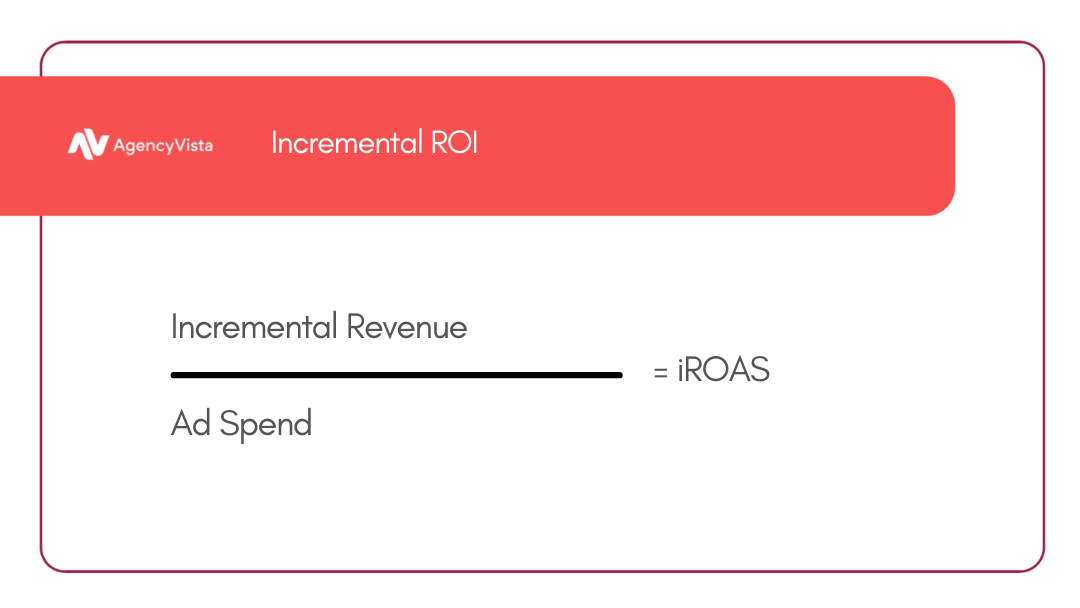
Incremental ROAS is the measure of the marketing efforts on the total revenue. The higher the iROAS, the more effective the growth rate. Lower the iROAS, less effective the brand targeting and growth. One of the main reasons for lower iROAS is that the marketing efforts and campaign may target customers who are not interested in buying the product or service.
ROAS is often confused with ROI (Return On Investment). ROI is used to calculate the overall marketing effectiveness, whereas ROAS is used to calculate the effectiveness of specific keywords, ad campaigns, ads, or groups. So, Incremental Return on Ad Spend (iROAS) measures the impact on revenue of only specific marketing efforts instead of the whole.
When digital marketers put effort into getting higher conversion rates, they need to ensure accuracy over numbers. The challenge is measuring incremental branding and marketing efforts in the long term. Different strategies in incremental measurement can affect the insights of the marketing strategy and the overall accuracy of the plan.
Three Systems for Measuring Incrementality
Digital marketing experts have access to plenty of data. However, the means to analyze the data and understand how to calculate it are critical. Incrementality can be measured by three methodologies.
The three methods are:
- MMM (Marketing Mix Modelling)
- PSA Testing (Public Service Announcement)
- Causal Attribution
1. MMM (Marketing Mix Modeling)
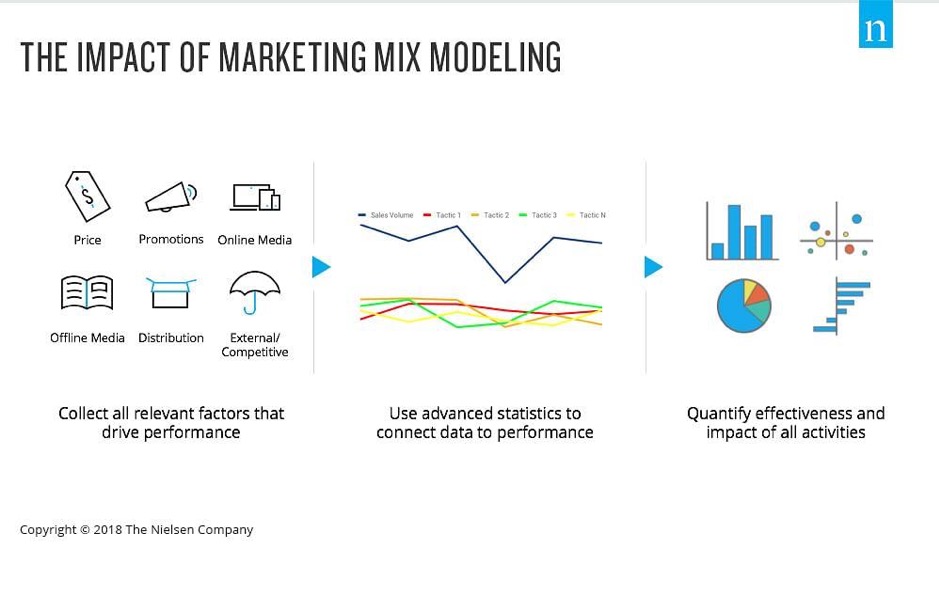
The MMM model assesses incrementality with an econometric modeling approach. MMM is a reasonably well-known method and has been used over the past two decades in industries like pharmaceuticals, retail, etc.
The MMM model is effective when:
- Marketers have to analyze large paid marketing budgets
- Most of the marketing efforts are non-trackable
Marketing methods are non-trackable when there are no directly trackable methods to quantify how the sales reach the end-user or customer. MMM is mostly a good option when marketing efforts are non-digital and results in sales via distributors or retailers (not brand-owned brick and mortar outlets, stores, or locations). The marketing efforts would be through network TV or displays (not online). The drawback with MMM is that it takes exceptionally long to produce the results in relevant quantifiable data.
2. PSA (Public Service Announcements)
As the name suggests, PSAs are marketing efforts made via public announcements. This methodology is excellent for incrementality testing. What the PSA methodology offers is that the target audience should be divided into two groups. One group gets the PSAs, while the other receives the branded marketing efforts. Marketers can then compare the difference in conversion rates between both groups to see which performs better.
The group with the PSA are usually the ones that will be counted as baseline minimal to buy products and services. In contrast, the branded marketing group measures the incremental lift between the revenue and marketing efforts. The PSA methodology has excellent results for marketers since it allows them to measure the benefits and efficiency of the marketing tactics.
However, PSA testing takes time and money. It costs the brand quite a lot of money to buy inventory for the less-performing PSA group. The other drawback is that marketers cannot fully leverage the PSA group’s outreach, marketing efforts, and conversion speed. Doing this hampers the control group and will not get you perfect results. The loss in time, opportunity, and audience is also relatively high.
Marketers usually have to do double the work in adding multiple exclusions to the paid ad segments of their marketing strategies to ensure there are no overlapping buys. This control is fragile and may need extra effort to monitor, resulting in a time, opportunity, and control loss.
3. Causal Attribution
Causal attribution is a recent upgrade from PSAs and is known to increase marketing inventory, and ad spends measurability. Causal attribution uses the Rubin Causal Model (statistics methodology) method to eliminate the drawbacks mentioned above in the PSA method for measuring incrementality.
In PSA methodology, marketers create groups to segregate the target audience and then track each metric based on the control or test group for ad spend and marketing revenue allocation. With the causal model, the groups are formed based on the data collected from the marketing campaigns – no need to spend additional time and effort in making groups.
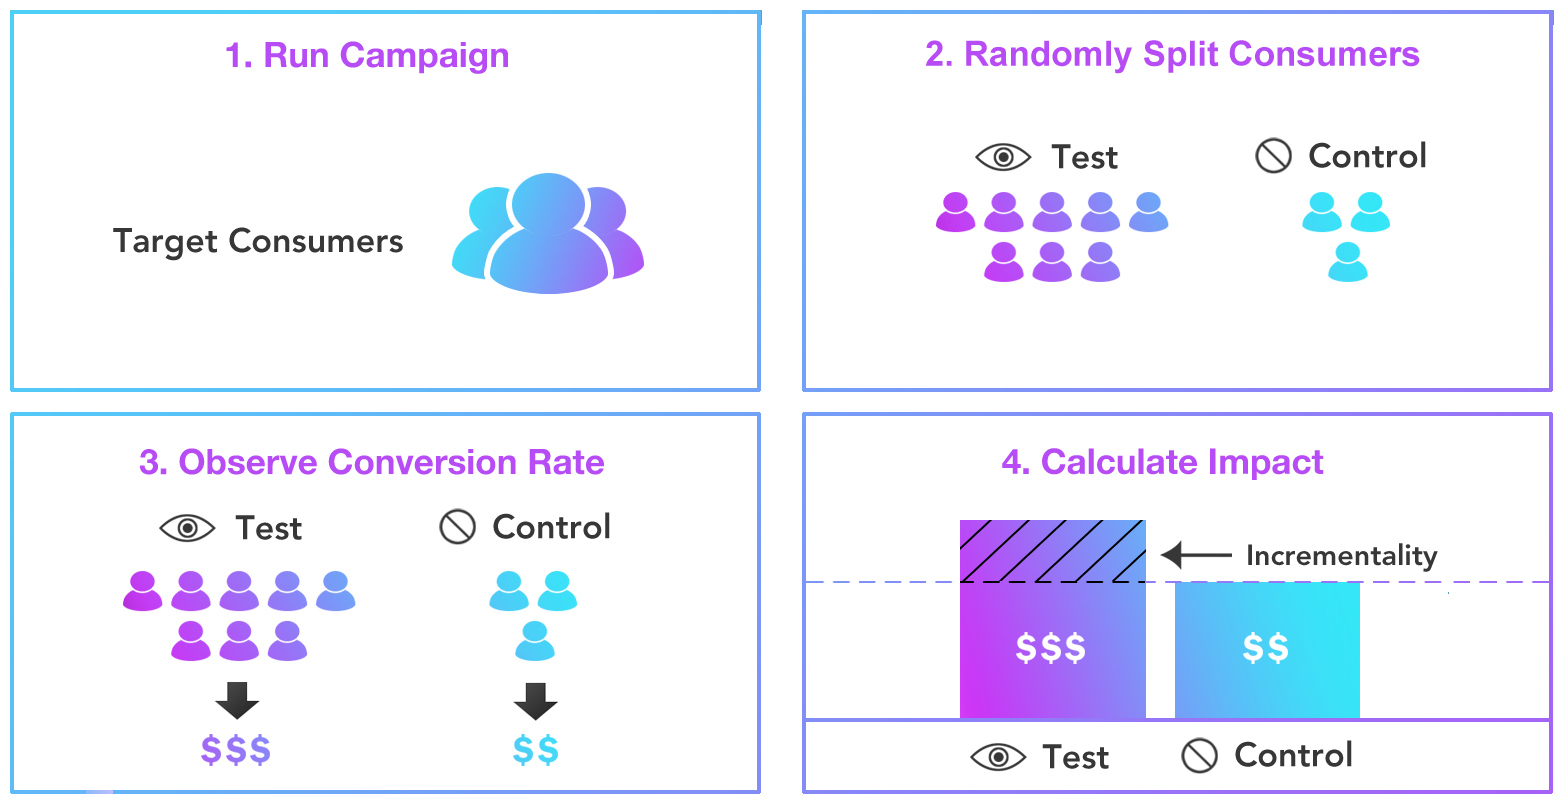
The causal attribution method can be applied to groups exposed (conversion rates) to paid ads versus those who were eligible for the ads but never purchased. Another example would be for marketers to carefully follow conversion rates for customers who were shown an advertisement versus those that were not.
The causal attribution methodology allows marketers to carefully follow the trend in conversion rates between groups exposed to baseline consumer behaviors (without ads) and those with total exposure to branded content, ads, and material. Incrementality measurement between the two groups is far more straightforward with the causal method. It involves less allocation of time and money, less control, and more quantifiable data in the long term. The elimination of the drawbacks from the PSA methodology has made the causal attribution method popular among marketers wishing to interpret accurate incrementality on the ad spend and other related marketing efforts.
Indications of Incremental ROAS Performance
Indication of incremental ROAS differs based on the percentage values after calculation. If the indicators groups are divided into two – test and control, the control group is the one with organic growth revenue (no exposure to ads and marketing collateral), and the test is exposed to ads. The percent results change the meanings and implications of the iROAS metric.
Incrementality is measured to gauge retargeting methods and the redistribution of budgets. Marketing budgetary allocations are usually re-prioritized only when there is a significant growth or revenue loss. iROAS helps identify these segments and helps with redirection and retargeting. Let us look at these implications to get a better understanding of iROAS.
If iROAS is equal to 100% (=100%)
Steady iROAS gets better with time. Considering the lifetime value (LTV) of users, retargeting the budgets are a good idea. The uplift or increase in LTV is usually measured over time, and the iROAS being equal to 100% is usually a good indicator of breaking even. This means that every dollar spent is similar to every dollar earned. Redirection and retargeting will help break the streak and ensure there is positive growth post-break-even.
The iROAS usually depends on how much the users or consumers will spend on the brand in their lifetime. The retargeting effort will matter significantly when applied to different economic verticals like gaming, retail, and pharmaceuticals.
If iROAS is < 100% (less than 100%)
If the iROAS is less than 100%, it could indicate poor performance and retargeting efforts. However, it also does not mean that the retargeting isn’t working at all. The iROAS is calculated at different stages in the marketing funnel, and conversion rates are counted per stage. It wholly depends on how marketers need to move users or consumers. Expecting a high iROAS at the beginning of a marketing strategy or campaign is an unrealistic goal. Marketers need to set SMART goals and work diligently towards achieving them.
Retargeting is necessary when there is a substantial loss in revenue due to customer acquisition costs. For example, if there is a sale on the website, and as a marketer, you have paid $15 for acquisition and retargeting, but the customer purchased something only worth $8, there is a negative return. The investment cost of redirecting should not surpass the customer sales cost.
For marketers considering this, there is a chance that the commencement of the marketing strategy may show poor incremental results. However, considering the lifetime value (LTV) of customers or users, there is a chance that the same consumers will probably order from the site or app sometime within the next six months. The iROAS will allow marketers to retarget the marketing strategy to ensure that the product or service is shown enticingly and dynamically. Composing engaging retargeting ads to get passive consumer groups will spike an increase in iROAS within a few months.
Marketers need to redistribute the marketing budgets to follow through on the better performing segments instead of continuing to drain the budget in underperforming ads. Experimenting with multiple new creatives and content can also help users receive personalized ads that resonate with their sentiments.
The most critical question that marketers have is when to retarget funds and reallocate the marketing budget. Ideally, if there is no increase in iROAS of over 100% within a month (post strategy implementation), it is good to start the retargeting efforts. Ideally, the iROAS should start climbing within 4 weeks from the time of commencement. If it isn’t, marketers should consider the possibility that something isn’t working correctly in the targeting.
Before reallocating the funds, performing a deep dive and checking where the users are being taken (when on the site) is helpful. Sometimes, the fault is not in the advertisement but in the backlinks and deep links embedded in the content. There could further be an issue with the configuration of the event tracker of the link provider. Marketers should also check the target demographics and ensure users are getting the correct brand message.
If these issues persist, it is best to change the creatives, double-check the technical parameters, messaging, and market segmentation.
If iROAS is < 100% (greater than 100%)
If the incremental ROAS is more than 100%, it is a good indicator that the retargeting works splendidly. According to experts, each 1% over 100% is an indicator of the return on advertising spend.
Once the iROAS has achieved the incrementality needed, the next step for marketers is to start scaling the marketing efforts without sacrificing the progress already made. Slight changes in creatives, changing product recommendations according to customer choices, refining the segmentation, and more could be done to help with the consistent scale-up.
If iROAS < 0 (less than zero)
If the iROAS is less than zero, it indicates that the control group is better performing between the control group and the test group. The control group is the one without exposure to any ads, marketing content, or collateral. Ideally, the iROAS should never be lower than zero. If it is, it means that the control and test group are behaving in identical buying patterns.
An iROAS less than zero is the worst-case scenario in marketing since there is absolutely no uplift in the control group. One of the main reasons for this statistical calculation could be that the sample size of both groups is less. Too few users can also result in negative incremental ROAS.
When the iROAS is less than zero, marketers will find it is best to rework the entire marketing strategy, ensure that all the backlinks are double-checked, retarget budgetary allocations, and deep dive into an analysis of why both groups behaved in identical patterns. Understanding the reasons behind the negative incremental ROAS will help avoid such scenarios in the future and will become instrumental in the segregation of funds and retargeting.
Incremental ROAS is genuinely an excellent metric for understanding whether retargeting is worth the initial marketing investment and budget. Marketers need to know how to analyze iROAS and use it to build better-targeted marketing campaigns. Steering the strategy in the right direction will result in higher returns in the long term.
How Can iROAS Help?
IROAS is a handy tool for comparisons in frameworks designed for deeper and more complex marketing patterns and strategies. As mentioned above, incremental ROAS can impact the percentage values, which show a fundamental benchmark to purchase your products and services.
Higher the iROAS, higher the sales, while lower the iROAS, lower the sales. This metric and explanation feels far too simple but is the basic crux of understanding and interpreting incremental return on ad spend. Low iROAS is also an indicator that other factors drive sales other than the marketing efforts– returning loyal customers, referrals, word of mouth, etc. These target audiences are excellent for the initiation of subscription-based sales for monthly or quarterly steady revenue.
IROAS is an extremely powerful tool for eCommerce and retail brands to increase their brand and marketing outreach. Marketers who need to improve their ROI (return on investment) from the ads, content collateral, and other marketing and branding content and material should leverage iROAS to increase market share. Marketers interpreting and using iROAS to their advantage can increase brand revenue, incremental growth and foresee consumer buyer behaviors and habits.
The complexity and interpretation of iROAS need some getting used to. Still, in the long term, it has excellent analytical benefits for redirecting and retargeting marketing funds to see better ROI on the entire ads campaign.
Marketers who need to work with multiple clients and run successful ad campaigns, marketing strategies and push vast quantities of content collateral can use iROAS to assess and redirect marketing spend to impact the overall strategy significantly.
